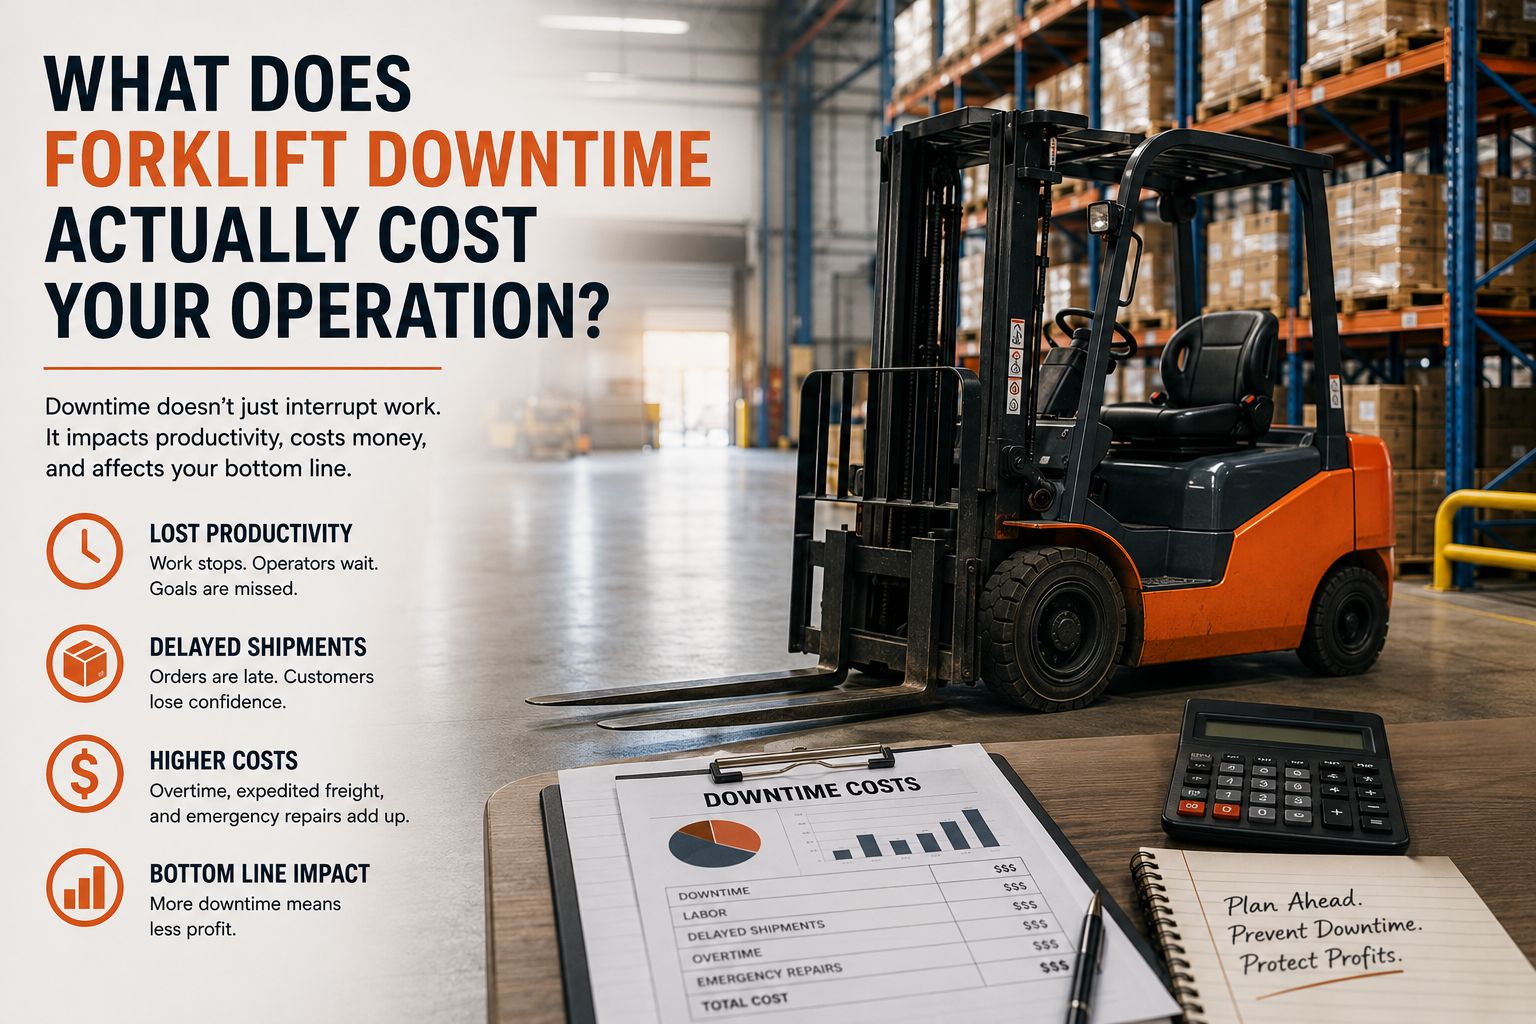
Most fleet operations don’t know what their forklift downtime actually costs. The number sits quietly outside the maintenance budget, distributed across a few unrelated line items: production targets missed, shipping commitments rescheduled, overtime to catch up, lost customer goodwill from late deliveries. None of those line items show up on a maintenance invoice. Most ops managers know the cost is real. Few have run the math.
Thank you for reading this post, don't forget to subscribe!The math matters more than most ops teams realize. For a typical 10-unit fleet running reactive maintenance, the annual cost of unplanned downtime usually exceeds the cost of preventative maintenance by a meaningful margin. The total cost picture (PM cost plus reactive repair cost plus downtime cost) is what determines whether your current maintenance approach is actually saving money or just appearing to.
This guide walks through what forklift downtime costs across different operation types, the industry benchmarks that ground the math, worked examples for typical Central Texas fleet operations, and how to build a defensible cost number you can take to your finance team or use to evaluate maintenance vendor options.
Why downtime cost is the line item nobody tracks
The cost that doesn’t show up on the maintenance invoice
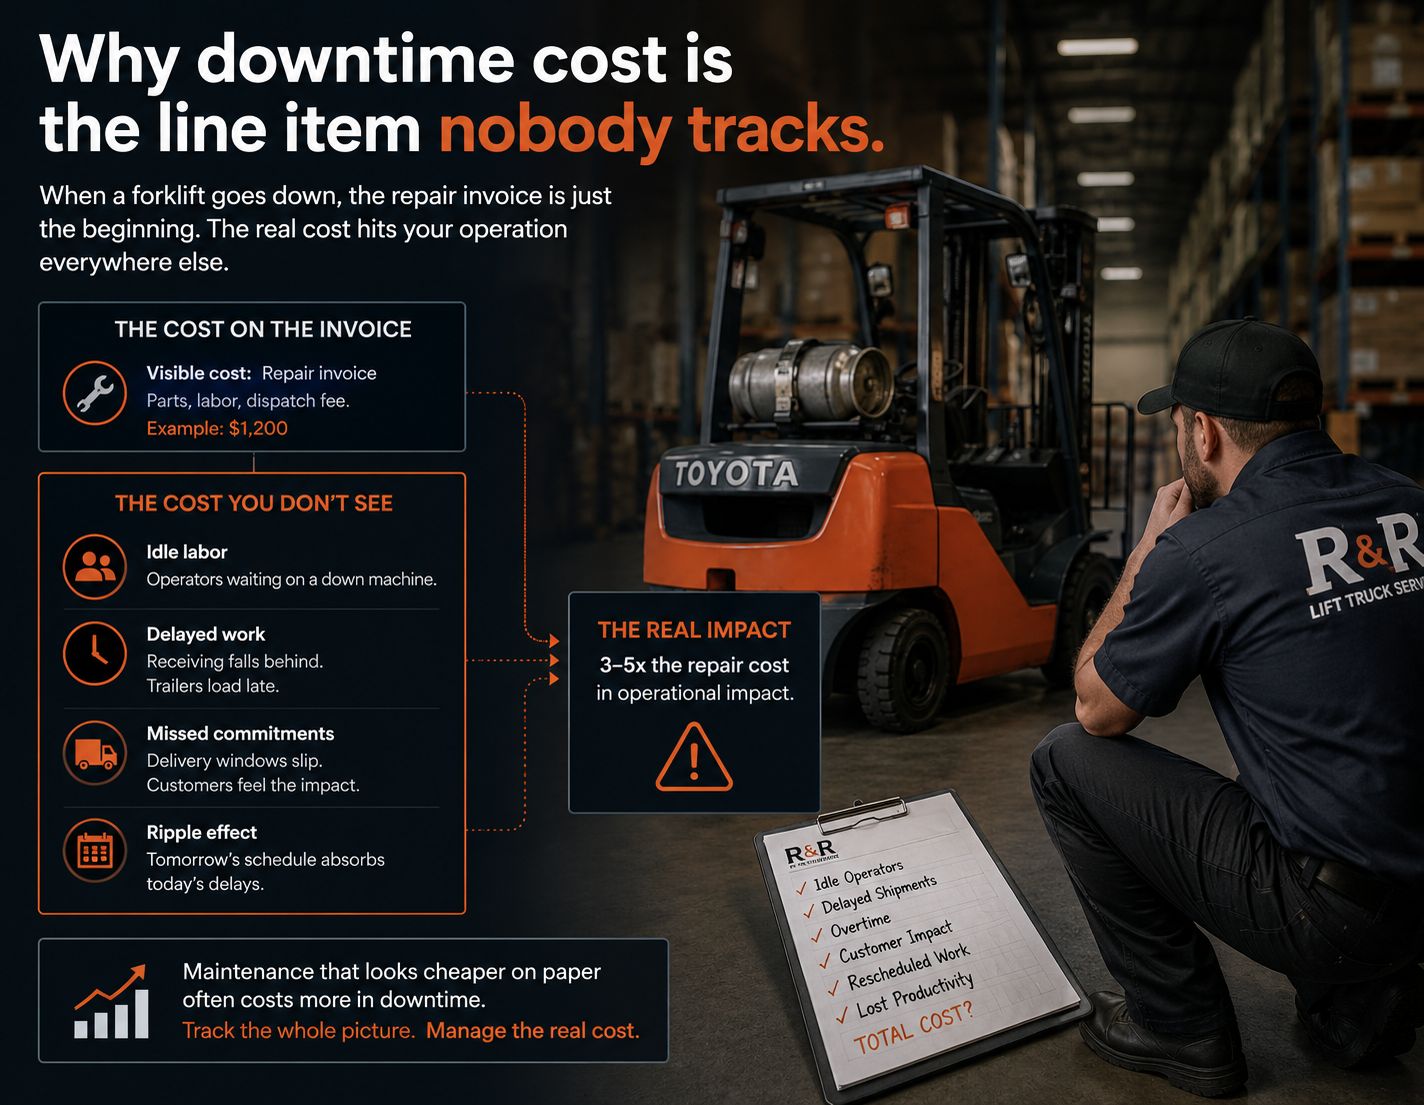
When a forklift goes down mid-shift, the immediate visible cost is the repair invoice: parts, labor, dispatch fee. That number lands in the maintenance budget where finance can see it. But the larger cost (the operational impact of the machine being out of service) gets distributed across other budget lines that don’t add up cleanly to a downtime number.
Consider a typical scenario. A forklift goes down at 10am during second shift in a distribution center. The machine is needed to stage outbound trailers. Two operators sit idle for an hour while another machine is reallocated from receiving. Receiving falls behind. The trailer that was supposed to load at 11am loads at 1pm. The customer’s delivery window slips. The next day’s schedule has to absorb the carryover.
The maintenance invoice for that incident might be $1,200 in parts and labor. The operational impact across the full chain might be three to five times that number. Most operations don’t have the visibility to reconstruct the full cost, so it goes unmeasured. The maintenance program that “saves money” by skipping thorough PM and accepting more reactive repair work is producing larger total costs than anyone sees.
Why this matters for fleet evaluation
The reason ops managers benefit from running the downtime cost math is straightforward: most maintenance vendor evaluations focus on the wrong line item.
Vendor A quotes $200 per PM visit. Vendor B quotes $500. Vendor A looks cheaper. But Vendor A’s 30-minute PMs miss developing issues that Vendor B’s 90-minute PMs catch. The result is that Vendor A’s fleet has more unplanned breakdowns, more emergency repair calls, and more downtime than Vendor B’s fleet. When you total all three line items (PM cost, reactive repair cost, downtime cost), Vendor B is often meaningfully cheaper despite the higher per-visit price.
Without running the downtime cost math, that comparison is invisible. With it, the comparison is obvious. The ops manager who can produce a defensible total cost number for their fleet has a better tool for vendor evaluation, internal budget justification, and operational planning than ops managers who only track the maintenance invoice line.
Industry benchmarks for forklift downtime cost
The hourly cost of downtime
Industry research and operational data converges on a few defensible ranges for forklift downtime cost per hour. The actual number varies by operation type, but the typical bands look like:
Light single-shift operations: $200 to $400 per hour. Smaller distribution centers, light manufacturing, retail-adjacent warehousing, operations where work can be reallocated to other machines or operators with limited friction.
Standard distribution and warehousing: $300 to $500 per hour. Mid-sized distribution centers, food and beverage distribution, e-commerce fulfillment operations running standard shifts. The most common range across Central Texas fleet operations.
High-cycle multi-shift operations: $500 to $800 per hour. Operations with tight throughput requirements, cross-dock operations, customer-facing fulfillment with delivery commitments, manufacturing supply chain support.
Production-line manufacturing: $1,000 to $5,000+ per hour. Forklifts feeding production lines where downtime stops the whole line, automotive and aerospace manufacturing, food processing operations with run-time commitments. The highest end of the range typically applies when forklift downtime translates directly to production line stoppage.
Cold storage and food safety: $400 to $1,000+ per hour. Refrigerated operations where downtime can introduce temperature management risk in addition to operational delay. Specialty operations may exceed this range when food safety considerations drive cost higher.
These ranges come from a combination of industry research, materials handling association data, and operational analysis published across the manufacturing and distribution sectors. The number for your specific operation depends on what your operation does and what the consequences look like when a machine isn’t available.
Frequency of unplanned breakdowns
The other half of the math is how often unplanned breakdowns happen in the first place. Frequency varies dramatically based on maintenance approach:
Reactive maintenance only. Operations that don’t run scheduled PM and only repair machines when they fail. For a 10-unit fleet, expect 2 to 5 incidents every two to three months, or 8 to 30 events per year. Older fleets and harder-running operations land at the higher end.
Cheap or transactional PM programs. Operations with PM coverage that doesn’t actually catch developing issues. For a 10-unit fleet, expect 1 to 3 incidents every two to three months, or 4 to 18 events per year. The PM is reducing some failures but missing the wear patterns that thorough PM would catch.
Thorough PM programs. Operations with PM coverage that actually inspects for developing issues at the visit. For a 10-unit fleet, expect 1 to 2 incidents per quarter, or 4 to 8 events per year. Most failures get caught at the inspection stage and addressed proactively rather than as emergency repairs.
Full maintenance contracts with thorough execution. Operations on full maintenance programs with strong execution from the vendor. Similar incident frequency to thorough PM programs, with the difference being how the cost is structured rather than how often things break.
Putting it together
Combining hourly cost with incident frequency gives you the annual downtime cost. For a 10-unit fleet running standard distribution at $400 per hour of downtime, with reactive maintenance producing 20 incidents per year at an average of 3 hours per incident:
20 incidents × 3 hours × $400/hour = $24,000 per year in downtime cost.
For the same fleet on a thorough PM program reducing incidents to 6 per year:
6 incidents × 3 hours × $400/hour = $7,200 per year in downtime cost.
Difference: $16,800 per year in downtime cost reduction from the PM program. That’s the math fleet maintenance programs are built around.
The three-line cost framework
Why one line item isn’t enough
The most common mistake ops teams make when evaluating maintenance approaches is comparing line items in isolation. PM cost gets compared to PM cost. Repair cost gets compared to repair cost. Downtime cost rarely gets compared to anything because it’s not on the invoice.
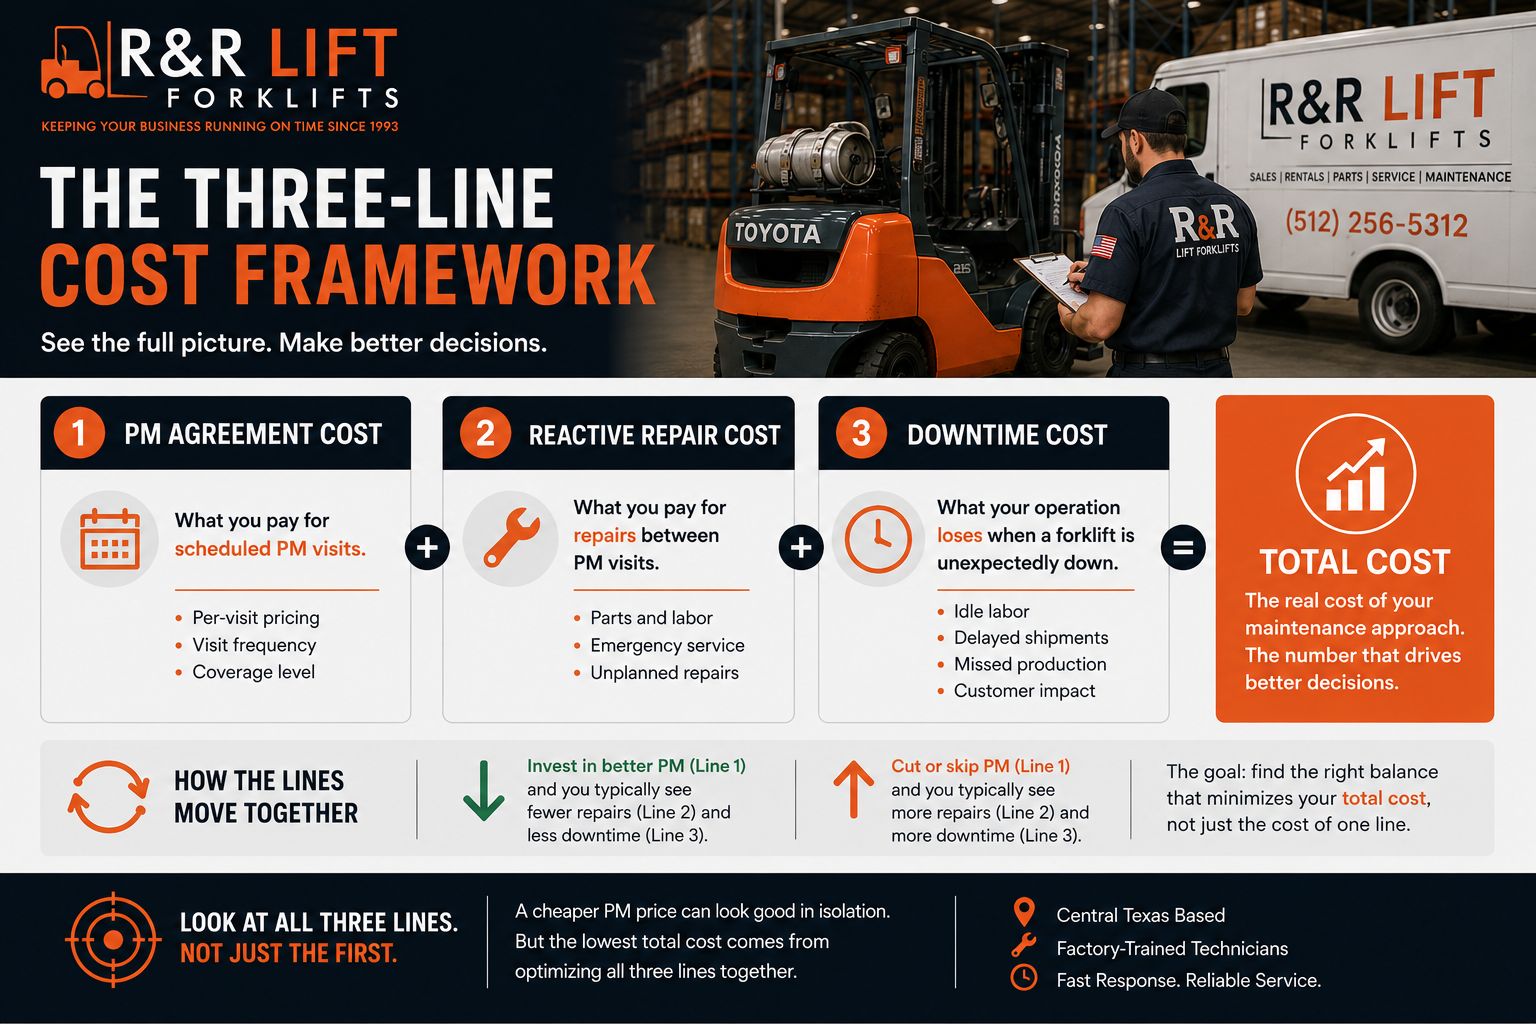
The framework that actually produces defensible decisions evaluates all three line items together:
Line 1: PM agreement cost. What you pay the vendor for scheduled PM visits.
Line 2: Reactive repair cost. What you pay for repairs between PM visits, either separately under a PM-only agreement or absorbed by the vendor under a full maintenance agreement.
Line 3: Downtime cost. What your operation loses when a forklift is unexpectedly out of service.
The total of these three is what your fleet’s maintenance approach actually costs your operation. When you compare maintenance vendors or evaluate whether to switch maintenance approaches, the right comparison is the three-line total, not any single line in isolation.
How the lines move together
The three lines are not independent. Investing more in Line 1 (more thorough PM) typically reduces Line 2 (less reactive repair work) and Line 3 (less downtime). Cutting Line 1 (cheaper or skipped PM) typically increases Lines 2 and 3.
The math doesn’t always favor more PM. For light-usage fleets, very thorough PM can produce diminishing returns. The optimization isn’t “always spend more on PM.” It’s “find the PM level that minimizes the three-line total for your specific operation.”
For most fleet operations running 10 or more units in standard usage patterns, the three-line total favors thorough PM. The PM line is higher, but Lines 2 and 3 drop more than enough to compensate. For lighter or smaller operations, the optimization may land differently. Running the math for your specific situation is the only way to know.
Why this framework changes vendor evaluation
When you shift from comparing PM line items to comparing three-line totals, vendor evaluation shifts substantially:
A vendor whose PM is cheap but thin produces a low Line 1 and high Lines 2 and 3. The total is often higher than vendors with more thorough (and more expensive) PM. The cheap vendor isn’t actually saving money. They’re shifting cost to lines that don’t show up as obvious expenses.
A vendor whose full maintenance contract is comprehensive but expensive produces a high Line 1 (the FM fee absorbs Lines 1 and 2) and low Line 3. For high-cycle operations with high downtime cost, the FM premium often pencils out. For light-usage operations with low downtime cost, the FM premium may be unnecessary.
The vendor that’s right for your fleet is the one that produces the lowest three-line total for your specific operation, not the one with the lowest headline price.
Worked examples
Example 1 – 10-unit distribution fleet, single shift
Operation profile: Mid-sized distribution center in Central Texas. 10 forklifts (mix of electric pallet jacks and sit-down counterbalance). Single shift, five days a week. Forklift downtime cost approximately $400 per hour.
Scenario A: Reactive maintenance, no PM program.
- PM cost: $0 (no scheduled PM)
- Reactive repair cost: 20 incidents per year × $1,200 average per repair = $24,000
- Downtime cost: 20 incidents × 3 hours per incident × $400/hour = $24,000
- Three-line total: $48,000 per year
Scenario B: Cheap PM program, $200 per visit, 4 visits per machine per year.
- PM cost: 10 machines × 4 visits × $200 = $8,000
- Reactive repair cost: 12 incidents per year × $1,200 = $14,400
- Downtime cost: 12 incidents × 3 hours × $400 = $14,400
- Three-line total: $36,800 per year
Scenario C: Thorough PM program, $500 per visit, 4 visits per machine per year.
- PM cost: 10 machines × 4 visits × $500 = $20,000
- Reactive repair cost: 6 incidents per year × $1,200 = $7,200
- Downtime cost: 6 incidents × 3 hours × $400 = $7,200
- Three-line total: $34,400 per year
The thorough PM scenario has the highest PM line but the lowest three-line total. The cheap PM scenario looks attractive on the PM line alone but produces a higher total cost. The reactive scenario looks cheapest in the absence of PM cost but produces the highest total by a wide margin.
Example 2 – 25-unit manufacturing fleet, two shifts
Operation profile: Manufacturing facility in Round Rock supporting tech sector production. 25 forklifts (mix of electric narrow-aisle, electric counterbalance, and LPG outdoor units). Two shifts daily, six days a week. Forklift downtime cost approximately $700 per hour due to production line dependencies.
Scenario A: Reactive maintenance, no PM program.
- PM cost: $0
- Reactive repair cost: 60 incidents per year × $1,500 average per repair = $90,000
- Downtime cost: 60 incidents × 3 hours × $700 = $126,000
- Three-line total: $216,000 per year
Scenario B: Cheap PM program.
- PM cost: 25 × 5 visits × $250 = $31,250
- Reactive repair cost: 30 incidents × $1,500 = $45,000
- Downtime cost: 30 × 3 hours × $700 = $63,000
- Three-line total: $139,250 per year
Scenario C: Thorough PM program.
- PM cost: 25 × 5 visits × $550 = $68,750
- Reactive repair cost: 12 incidents × $1,500 = $18,000
- Downtime cost: 12 × 3 hours × $700 = $25,200
- Three-line total: $111,950 per year
Scenario D: Full maintenance contract, $5,500 per machine annually.
- Annual contract fee: 25 × $5,500 = $137,500 (covers PM + repair work)
- Downtime cost: 12 × 3 hours × $700 = $25,200
- Three-line total: $162,700 per year
Interesting result. For this fleet, the thorough PM program produces the lowest three-line total. The full maintenance contract is more expensive in total because the contract fee structure is priced to absorb both PM and reactive cost, plus margin. For an operation with predictable maintenance needs and good vendor relationships, PM-only with thorough execution can beat FM on total cost. For operations that value budget predictability over absolute lowest cost, the FM scenario may still be preferable despite costing more.
Example 3 – 8-unit small operation, light usage
Operation profile: Small distribution operation in the Austin area. 8 forklifts, mostly electric pallet jacks plus 2 sit-down counterbalance units. Single shift, four to five days a week, light usage. Forklift downtime cost approximately $250 per hour.
Scenario A: Reactive maintenance
- PM cost: $0
- Reactive repair cost: 10 incidents per year × $900 = $9,000
- Downtime cost: 10 × 2.5 hours × $250 = $6,250
- Three-line total: $15,250 per year
Scenario B: Light PM program, 2 visits per machine per year
- PM cost: 8 × 2 visits × $300 = $4,800
- Reactive repair cost: 6 incidents × $900 = $5,400
- Downtime cost: 6 × 2.5 hours × $250 = $3,750
- Three-line total: $13,950 per year
Scenario C: Thorough PM program, 4 visits per machine per year
- PM cost: 8 × 4 visits × $500 = $16,000
- Reactive repair cost: 3 incidents × $900 = $2,700
- Downtime cost: 3 × 2.5 hours × $250 = $1,875
- Three-line total: $20,575 per year
For this operation, the light PM scenario actually beats thorough PM on total cost. The fleet is small enough and usage is light enough that the marginal value of additional PM time doesn’t pencil out. The math doesn’t always favor more PM. This is the kind of operation where individual PM visits scheduled as needed, rather than a full fleet program, often produces the best economic outcome.
Building a defensible number for your operation
Estimating your hourly downtime cost
If you don’t have a precise hourly downtime cost number for your operation, the following framework produces a defensible estimate:
Method 1: Operator and operational cost- Sum the hourly cost of operators idled when a forklift is down, the hourly value of the work that doesn’t happen, and the operational impact on adjacent processes. A two-operator team idled for an hour at $25/hour each, plus an estimated $300/hour in lost throughput, plus knock-on impact. Estimated $400/hour.
Method 2: Production output value- For operations where forklift downtime translates to production output reduction, calculate the hourly output value lost. A line producing $1,000/hour of finished goods, where forklift downtime stops the line, has a downtime cost approximating the line value (sometimes higher when accounting for restart inefficiency).
Method 3: Customer commitment cost- For operations with delivery commitments that downtime affects, calculate the cost of late deliveries, customer service overhead, and goodwill impact. Often the hardest to quantify but real.
Method 4: Industry benchmark- When operation-specific data is hard to gather, fall back to the industry ranges in Section 2. Pick the band that matches your operation type and use the midpoint.
The number doesn’t have to be perfect. A defensible estimate within 30% of accurate is enough to make maintenance decisions on. Trying to get the number down to the dollar before deciding is over-optimization. The decisions you’ll make based on this analysis don’t change if the number is $400/hour vs $440/hour.
Estimating your incident frequency
If you don’t have clean records of unplanned breakdown frequency, a few approaches produce defensible estimates:
Pull invoices for the last 12 months. Sort by emergency or unplanned repair work versus scheduled work. Count the unplanned events.
Ask your operations team. Front-line operators and supervisors typically have a strong intuition for how often equipment is down. “We have a forklift down two or three times a month” is a useful starting point that you can refine with invoice data.
Estimate from age and usage. Older fleets and harder-running operations have higher incident frequency. The reference ranges in Section 2 give you a starting point based on maintenance approach, fleet age, and usage intensity.
What to do with the number
Once you have a defensible three-line cost total, you have a tool that improves several decisions:
Vendor evaluation. Compare maintenance vendor quotes on three-line total cost rather than line-item PM price.
Internal budget justification. Make the case for maintenance investment to finance with concrete operational impact data, not just “we should spend more on PM.”
Operational planning. Identify which machines or operations have disproportionate downtime impact and target maintenance investment there.
Contract negotiation. When negotiating maintenance agreements, the three-line total is a better anchor than per-visit pricing. It shifts the conversation from “your visits cost more” to “what’s the total cost picture you’re producing.”
We built a calculator that runs this math interactively against your specific fleet numbers. If you want to see what the three-line total looks like for your operation, that’s the fastest path. If you’d rather work through the math directly using the framework above, the calculator isn’t required to produce a useful number.
Run the math. The answer might surprise you.
Most fleet operations don’t run the three-line cost math because the data is scattered and the analysis takes time. The operations that do run it usually find that their current maintenance approach isn’t optimized, sometimes by a meaningful margin in either direction. The exercise produces clarity that’s hard to get any other way.
If you want to walk through this analysis on your specific fleet, our team is happy to do that as part of a no-cost site walk. We’ll look at your fleet, run the math against your operational reality, and tell you what the picture actually looks like. The output is useful even if you don’t end up engaging us as a vendor.