Every forklift in your fleet is somewhere on a curve from new to end-of-life. The hard part isn’t knowing that machines wear out. It’s knowing exactly when a specific machine crosses the line from “worth maintaining” to “worth replacing,” and making that call before a major failure forces the decision under pressure.
Get the timing wrong in one direction and you pour repair money into a machine that should have been retired. Get it wrong in the other direction and you replace a machine that had years of productive life left, usually because a dealer recommended it. The decision has real money on both sides.
This guide is a practical framework for forklift lifecycle management: how to evaluate where each machine in your fleet actually sits, the four outcomes a machine can fall into, the economic thresholds that should drive the decision, and the signals that tell you a machine is approaching a lifecycle transition. We’re an independent service specialist, which means we don’t sell new forklifts and have no structural reason to push you toward replacement. We’ll be straight about when replacement is genuinely the right call and when it isn’t.
Why lifecycle management gets done badly
The two failure modes
Most fleet operations handle lifecycle management reactively, and it produces one of two expensive failure modes.
Failure mode one: running machines into the ground. A forklift starts needing more frequent repairs. Each individual repair seems justifiable in the moment (“it’s just a hydraulic line,” “it’s just the brakes this time”). Nobody steps back to total the annual repair spend on that specific machine. By the time someone notices the machine has cost more in repairs over 18 months than a replacement would have, the money is already spent. The machine has become a money pit hiding in plain sight.
Failure mode two: replacing too early. A dealer’s service tech, during a routine call on an aging machine, suggests it’s “getting to the point where you should think about replacing it.” There’s a new unit available. The recommendation sounds reasonable. The machine gets replaced. But the machine had three or four more good years in it, and the early replacement cost the operation tens of thousands in capital that didn’t need to be spent yet. This failure mode is particularly common when the service provider also sells equipment.
Both failure modes come from the same root cause: no systematic framework for evaluating where each machine actually sits on its lifecycle curve.
Why dealers and independents see this differently
It’s worth being direct about the structural difference here, because it shapes the recommendations you’ll get.
A dealer’s service operation exists within an equipment-sales business. When a dealer’s tech evaluates an aging machine, the recommendation is filtered (often unconsciously) through the question “is there a sales opportunity here.” That doesn’t make dealer techs dishonest. It means the incentive structure tilts recommendations toward replacement, especially on machines near the boundary.
An independent service provider doesn’t sell new equipment. When an independent tech evaluates an aging machine, the recommendation is shaped only by the economics of that specific machine: what it costs to keep running versus what it would cost to replace. There’s no new-unit sale on the other side of the recommendation.
This is the single biggest reason fleet operators benefit from getting lifecycle recommendations from someone who doesn’t profit from the replace decision.
The four lifecycle outcomes
Every machine in your fleet falls into one of four lifecycle outcomes at any given time. The goal of lifecycle management is knowing which outcome applies to each machine and acting on it deliberately.
Outcome 1 – Keep maintaining
The machine is in good condition, repair costs are low and predictable, and it has substantial productive life remaining. The right action is straightforward: keep it on the PM schedule, address issues as they arise, and re-evaluate periodically.
Most machines in a well-maintained fleet sit here. The signals that a machine belongs in this category: annual repair cost well below 20 percent of replacement cost, no recurring major component issues, hour meter within the machine’s reasonable service life for its type, and no structural or safety concerns.
Outcome 2 – Invest in major rehab
The machine has high productive value but needs a significant one-time investment to extend its life: a major component rebuild (engine, transmission, mast), a hydraulic system overhaul, or similar. The question is whether the rehab cost, amortized over the additional life it buys, is cheaper than replacement.
Rehab makes sense when the machine is fundamentally sound but has one or two major systems at end of life, the rehab cost is meaningfully less than replacement (typically under 40 to 50 percent of replacement cost), and the rehab buys enough additional service life to justify the investment (usually three or more years). A well-chosen rehab can be the most cost-effective option in the entire framework, because it extends a known, reliable machine for a fraction of replacement cost.
Rehab does not make sense when the machine has multiple systems approaching end of life simultaneously (fixing one just means the next fails soon after), when the rehab cost approaches replacement cost, or when the machine’s basic platform is obsolete enough that parts availability is becoming a problem.
Outcome 3 – Run to failure with replacement planned
The machine is approaching end of life but still functional. Rather than replacing it now (wasting remaining life) or investing in rehab (not worth it on a machine this far along), the right move is to run it until a significant failure occurs, with a replacement already identified and budgeted so the transition happens smoothly rather than as an emergency.
This outcome suits machines that are reliable enough for continued use in the near term but old enough that major investment isn’t justified, machines in non-critical applications where occasional downtime is tolerable, and situations where the operation wants to defer capital spend but knows the replacement is coming.
The key to doing this well is planning. Run-to-failure without a replacement plan is just the first failure mode (running machines into the ground) with better branding. Run-to-failure with a budgeted, identified replacement ready to deploy is a legitimate lifecycle strategy.
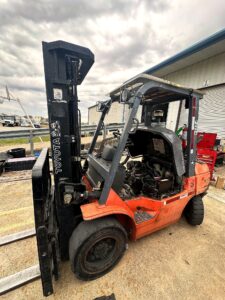
Outcome 4 – Replace now
The machine has crossed the line where continued maintenance is no longer economical. Annual repair costs are high and climbing, multiple major systems are at or near failure, downtime frequency is disrupting operations, or parts availability is becoming a genuine problem. The right action is replacement, planned and executed on the operation’s timeline.
Replacement is genuinely the right call when annual repair cost consistently exceeds 25 to 30 percent of replacement cost, when the machine has become a recurring source of unplanned downtime, when multiple major components are failing in succession, or when safety or compliance issues can’t be economically resolved.
We say this clearly because credibility requires it: sometimes replacement is the right answer. An independent service provider that never recommended replacement would be as untrustworthy as a dealer that always did. The point isn’t to avoid replacement. It’s to replace at the right time, for the right reasons, on your timeline.
The economic framework
The repair-cost-to-replacement-cost ratio
The single most useful metric in lifecycle management is the ratio of annual repair cost to replacement cost. It cuts through most of the noise.
Track, for each machine, the total repair and maintenance spend over the trailing 12 months. Compare it to the cost of replacing that machine with an equivalent unit. The resulting percentage tells you a lot:
- Under 15 percent: The machine is economical to maintain. Keep it (Outcome 1).
- 15 to 25 percent: The machine is entering the zone where the decision needs attention. Evaluate whether a one-time rehab resets the clock (Outcome 2) or whether the trend is heading toward replacement.
- 25 to 35 percent: The machine is approaching or past the economical threshold. Plan replacement (Outcome 3 or 4) unless a specific rehab clearly resets the economics.
- Over 35 percent: The machine is costing too much to keep. Replace it (Outcome 4).
These thresholds aren’t absolute. A machine in a critical application where downtime is expensive justifies replacement at a lower ratio, because the downtime cost compounds the repair cost. A machine in a non-critical application can run at a higher ratio because occasional downtime is tolerable. But the ratio is the starting point for the conversation.
Why downtime cost belongs in the calculation
Repair cost alone understates the true cost of an aging machine. A forklift that breaks down repeatedly isn’t just costing you repair invoices. It’s costing you the operational impact of the downtime each time it fails.
A machine with a 20 percent repair-to-replacement ratio might look like a “keep maintaining” candidate on repair cost alone. But if that machine’s failures are causing repeated unplanned downtime in a high-throughput operation, the downtime cost might push the true cost of keeping it well past the replacement threshold. The repair invoices are only part of the picture.
When evaluating an aging machine, total three things: the repair cost, the downtime cost the machine’s failures are causing, and the productivity cost of operators working around an unreliable machine. The sum is the real cost of keeping it, and it’s often substantially higher than the repair invoices alone suggest.
The capital timing dimension
Lifecycle decisions don’t happen in a vacuum. They interact with the operation’s capital budgeting cycle, tax considerations, and cash flow.
Sometimes the economically optimal replacement timing conflicts with capital availability. A machine might cross the replacement threshold mid-year when capital budget is committed elsewhere. In those cases, run-to-failure with planned replacement (Outcome 3) becomes the bridge: keep the machine running through the budget cycle, with the replacement identified and ready to deploy when capital frees up.
The point is that lifecycle management is partly an economic calculation and partly an operational planning exercise. The economics tell you what the machine is worth keeping. The planning tells you when and how to execute the transition.
The signals to watch
Signals a machine is approaching a lifecycle transition
Several observable signals indicate a machine is moving from “keep maintaining” toward a rehab or replace decision:
Rising repair frequency. The machine needs service more often than it used to. The interval between repairs is shrinking. This is usually the earliest signal and the most reliable.
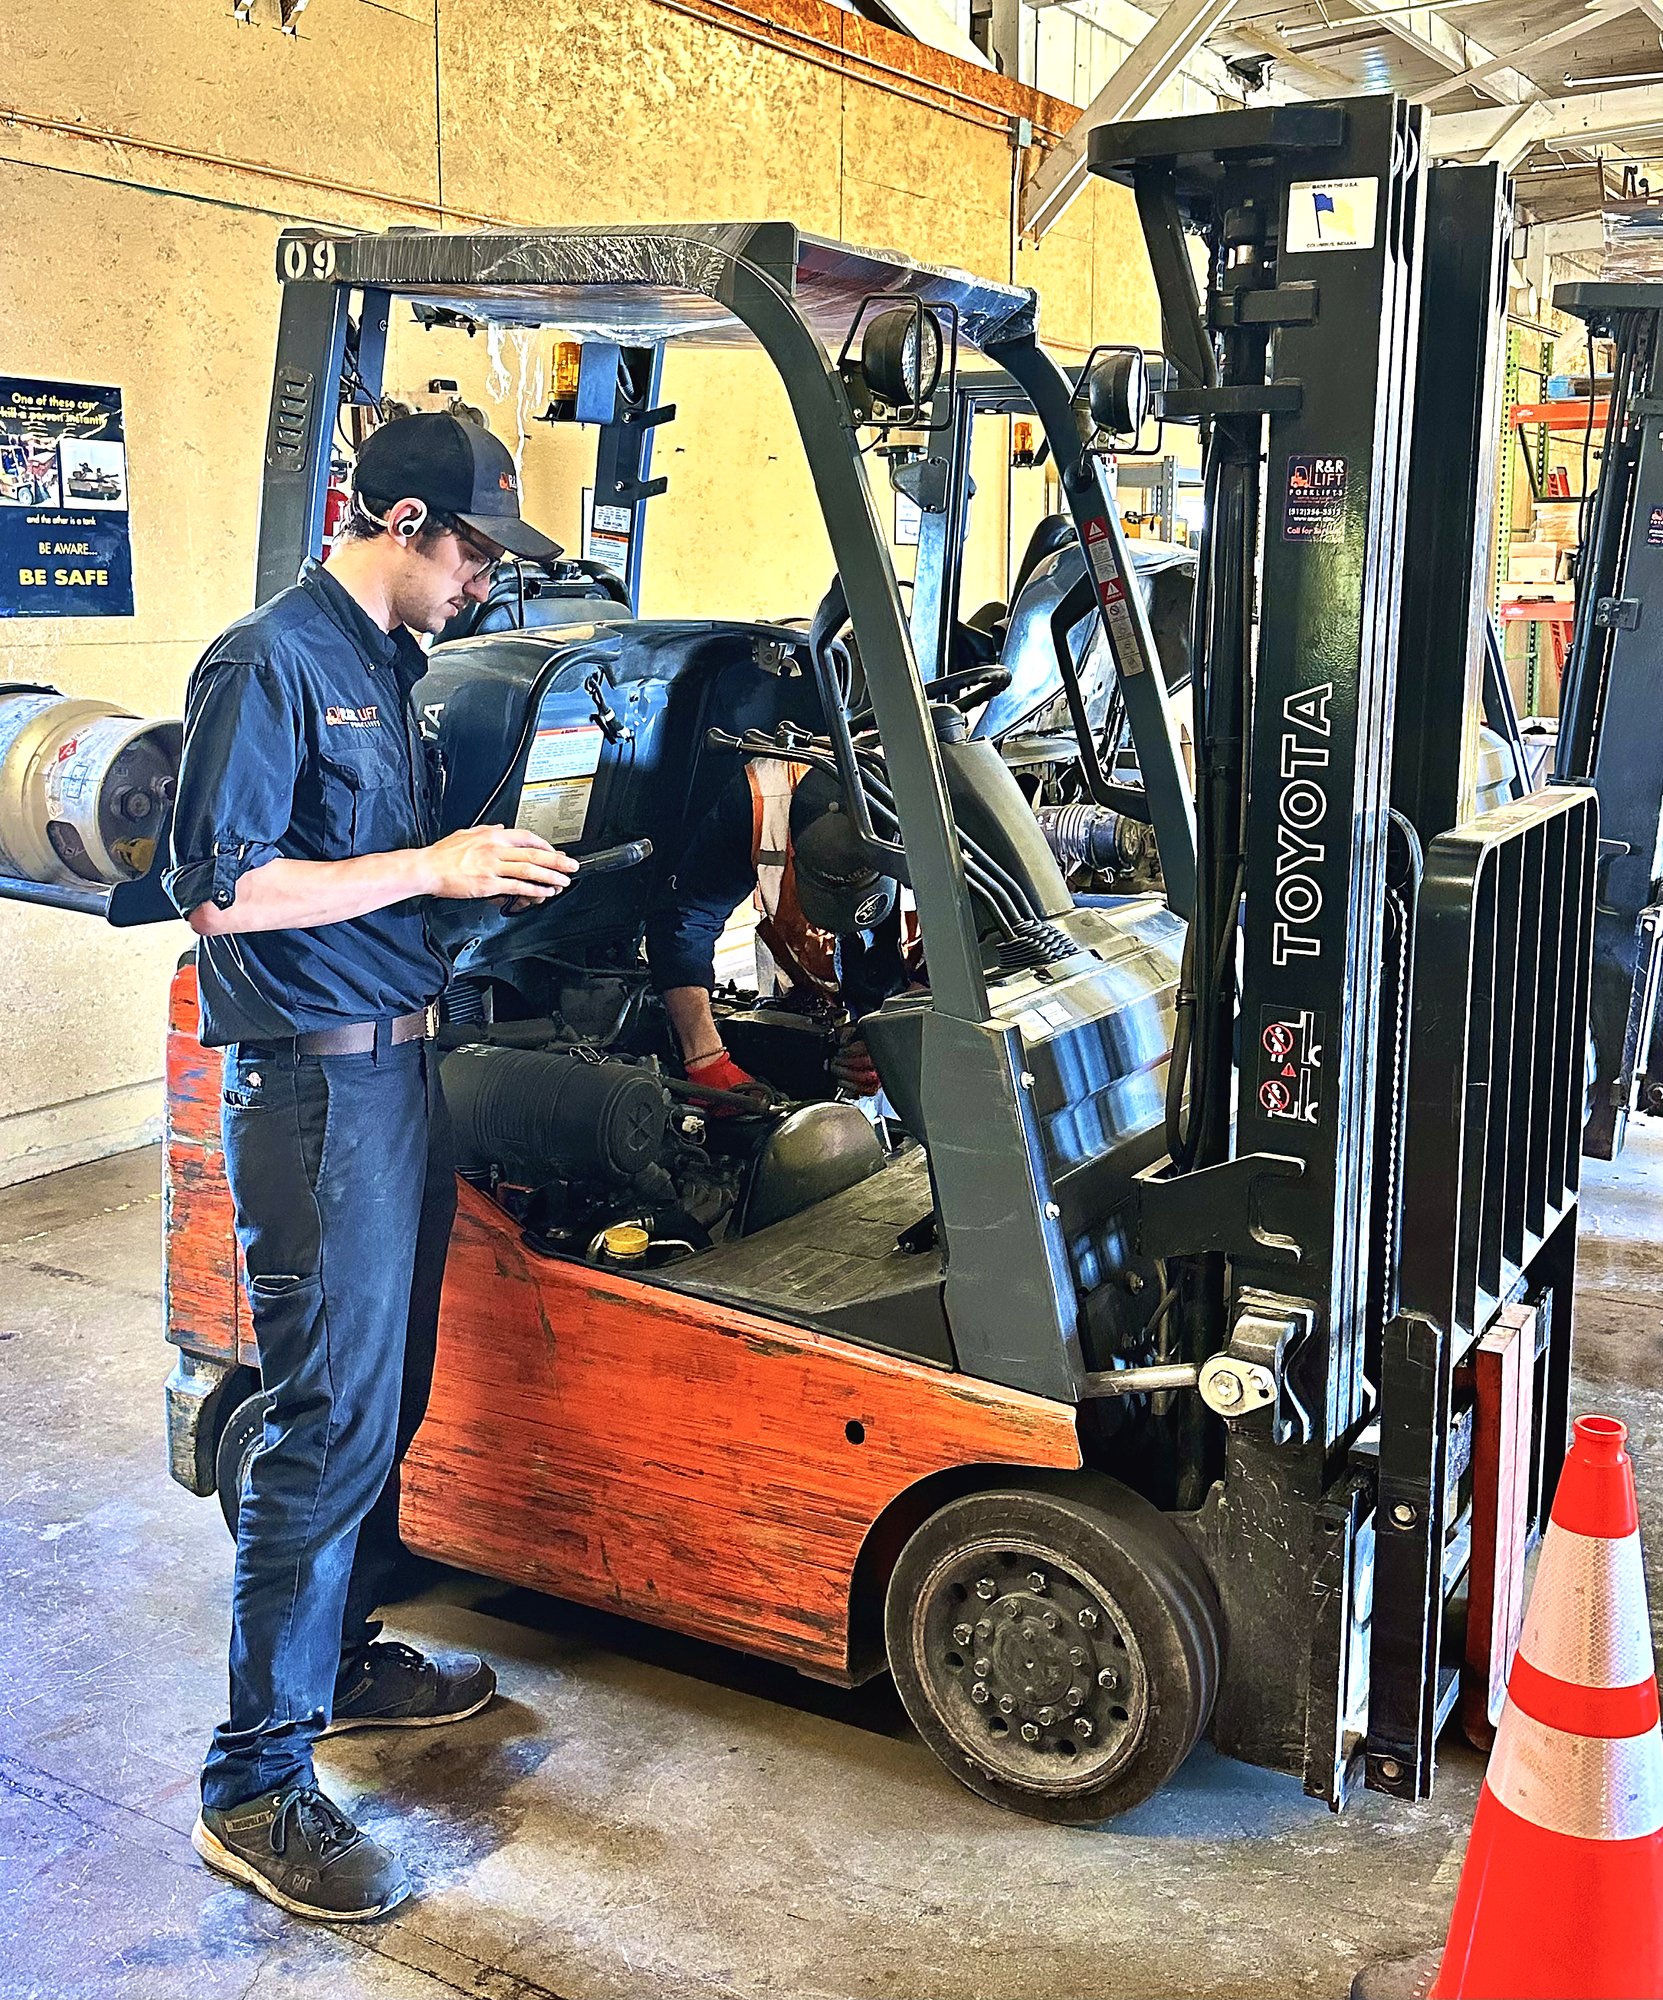
Major component warnings. A thorough PM inspection flags a major system (engine, transmission, hydraulics, mast) showing significant wear. Major component failure is the most expensive kind, and catching the warning early enables a planned decision rather than an emergency one.
Parts availability friction. Sourcing parts for the machine is taking longer or getting more expensive. This is a sign the platform is aging out of easy supply, which affects both repair cost and downtime duration.
Increasing downtime duration. Repairs that used to take hours now take days, often because of parts availability or because the machine’s issues are more complex. Longer downtime per incident raises the true cost of keeping the machine.
Operator complaints. Operators working a machine daily often sense its decline before the data confirms it. Persistent operator complaints about a specific machine’s reliability or performance are worth investigating.
Why a PM program catches these signals early
This is where a structured maintenance program earns its value in lifecycle management specifically. A program that documents every service call and produces fleet-level reporting gives you the data to see these signals coming.
Reactive maintenance can’t do this. When you only service machines as they break, nobody is tracking the trend across each machine’s history. The repair frequency rises, the costs climb, but without documentation pulling it together, the pattern stays invisible until it’s expensive.
A program with proper documentation flags the machine that’s trending toward a lifecycle decision 6 to 12 months before the decision becomes urgent. That lead time is the difference between a planned, budgeted, smooth replacement and an emergency replacement made under pressure when a machine finally dies mid-shift.
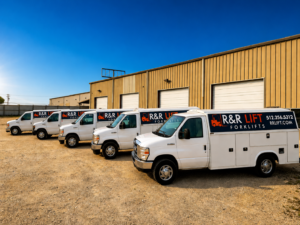
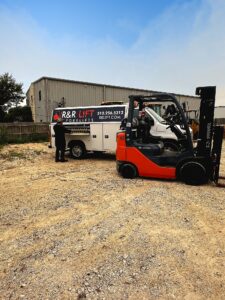
How R&R handles lifecycle management
Lifecycle recommendations as part of the program
For fleet program clients, lifecycle management is built into the monthly fleet reporting. Every machine in the fleet gets tracked: service history, repair cost trend, and condition assessment. When a machine starts trending toward a lifecycle decision, it gets flagged in the report with a recommendation and a timeline.
The recommendation is shaped only by the economics of the specific machine. Because we don’t sell new equipment, there’s no sales motivation pulling the recommendation toward replacement. When we say a machine has three more good years, nobody on our team loses anything by saying it. When we say a machine has crossed the replacement threshold, it’s because the math says so.
What we do and don’t do on replacement
To be clear about the boundaries: we don’t sell new forklifts. When a machine genuinely needs replacement, we’ll tell you, and we’ll help you understand what to look for in a replacement, but we’re not the ones selling you the new unit. We do sell pre-owned forklifts to existing fleet clients who need to add or swap a unit, as a client accommodation rather than a primary business.
What this means practically is that our lifecycle recommendations come without the conflict of interest that shapes dealer recommendations. You get an honest read on each machine, and you make the replacement decision with whatever vendor you choose for the new equipment.
The right time to replace a forklift is a math problem, not a sales pitch.
Lifecycle management done well saves real money in both directions: it keeps you from pouring repair dollars into machines that should be retired, and it keeps you from replacing machines that had years of life left. The framework isn’t complicated, but it requires data, and it requires recommendations from someone whose advice isn’t shaped by what they’re selling.
If you want an honest assessment of where the machines in your fleet sit on their lifecycle curves, that’s part of what a fleet program with us provides, and it’s part of what we’d cover in a no-cost site walk. We’ll tell you which machines are solid, which are approaching decisions, and which have genuinely crossed the line. No sales pitch on the replacements, because we’re not selling them.